The Chart Tree
Add
a chart
You can view matrices graphically
using charts.
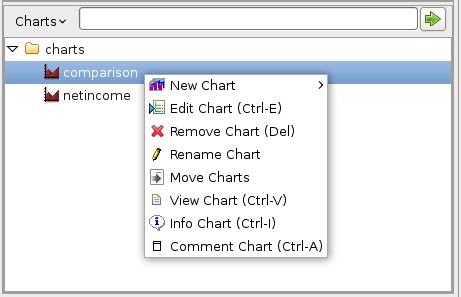
To add a chart, click on the Charts
tree view in the project toolbox with the right button of the mouse.
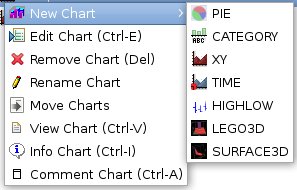
In the pop up menu select New chart.
A
sub-menu
appears, with
several choices:
We
have three groups of charts:
- pie charts, which can display one 2D series.
- multi-series charts
(category, xy, time). They are called like that because each chart can
display multiple series (multiple matrices).
- high-low charts, which displays 4 or 5 series (high, low, open, close, volume).
- 3d charts (lego3d,
surface3d), which can display one 3D series.
The multi-series chart can display series of
these types:
- line
- line
3D
- bar
- bar 3D (only the
category chart)
- area
- scattered
- scattered
line.
The series type is decided when adding a new series to the chart in the multi-series chart editor.
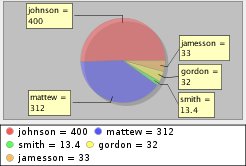
Let's give a close look at each single chart type:- pie
charts (JFreeChart, only one series per chart):
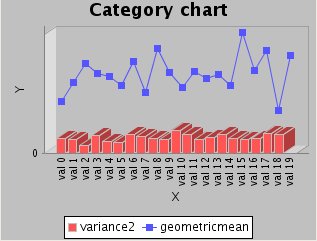
- Category
chart (JFreeChart, multiple series per chart), where each y value of
each series is related to a label on the x
axis:
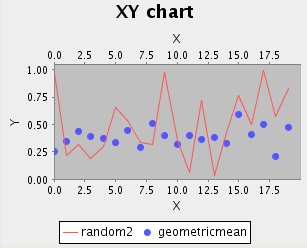
- XY,
in which each element of the series is an <x,y> point.
The x sequence is not necessarily linear and regular (1,2,3...), so the
line chart can have a zig-zag pattern, like in the first example:
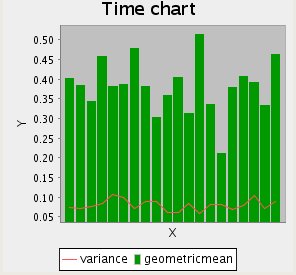
- Time,
in which the x axis is a time axis:
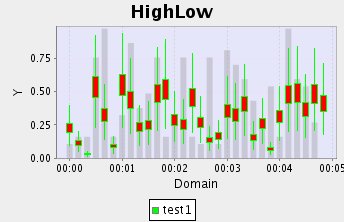
- HighLow, that show 4 or 5 values at the same time (high, low, open, close, volume) on a time axis:
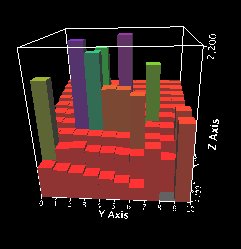
- Lego3D, which is a 3D bar chart:
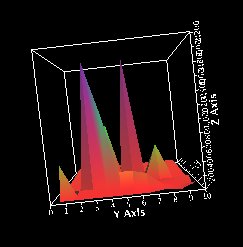
- Surface3D, which represents the values using a 3D function representation:
Selecting
the chart to add in the menu, the chart editor for that
kind of chart opens.
View a chart
Right
click with the mouse on the chart name in the tree and
select the View Chart menu, which opens the chart viewer. You can also
view the
chart double-clicking on the chart name.
Edit
a chart
Right click with the mouse on the chart name in the
tree and
select the Edit Chart menu. The same editor you
used to create the chart opens, with the chart settings. You can change
the chart and save it again.
Remove a chart
Right
click with
the mouse on the chart name in the tree and select the Remove
Chart menu. You need to confirm to remove. You can always
remove a chart.
Move one or more charts
Right
click with
the mouse on the chart name in the tree and select the Move
Charts menu. Select the package where you want to move the chart to using the choose package dialog. If you select more charts all will be moved to the final package.
Rename a chart
Right
click with the mouse on the chart name in the tree and
select the Rename Chart menu. The name-package
dialog appears. Set the new name and package and click OK.
The chart is
renamed, both in the project toolbox and in the file system. You need
to confirm.
Comment a chartRight
click
with the mouse on the chart name in the tree and select the Comment
Chart menu. Then you can write your comment in the comment dialog.
Get
information about a chart
Right
click with the mouse on the chart name in the tree
and select the Info Chart menu. The chart information view
appears.
