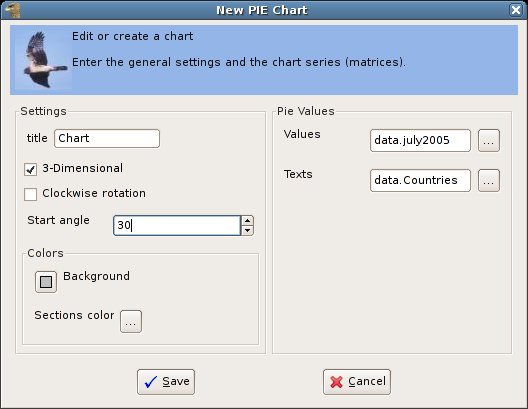
The Pie Chart Editor
The
pie chart editor is special
because only one series can be showed by a pie chart.
The Settings Panel
In the Settings
panel of
the
editor you can specify:
- the chart title,
which appears on the top of the chart.
- if the
chart is2 or 3-dimensional
(3-dimensional being only a 3d visual effect)
- if the chart (which is a
circle) shows the series items clockwise or
anti-clockwise.
- the
angle from the right of the circle (3 o'clock) in
which the first item of the series is placed.
- the
chart background color. To change it click on the colored button,
that opens the color
selection dialog.
- the
pie chart sections colors. To change them click on
the ... button, which opens
the series color dialog.
The Values Panel
In
the
Values panel of the editor you need to set:
- values:
a 1-dimensional numerical matrix (vector) that contains the values
showed by the chart. The ... button opens the matrix selection dialog
with all the 1-dimensional numerical matrices.
- texts:
a 1-dimensional textual matrix (vector) that has the same size of the
values matrix and contains one text for each item of the values matrix
(in the same order). The ... button opens the matrix selection dialog
with all the 1-dimensional textual matrices.
The texts are
used as labels in the charts.

