The
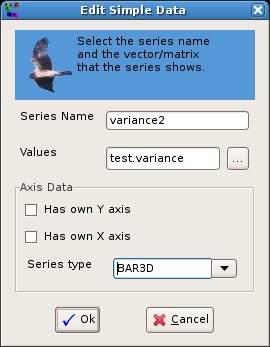
Add Simple Data Dialog
This
is the dialog to enter series in a category chart.
Here
you specify the series
name and select the values,
which are a 1-dimensional
numerical matrix (vector) that defines the series.
To select
the matrix, click on the ... button, which opens the matrix selection dialog.
In
the Axis Data panel, you need to tell the type of matrix
(line, bar, area...) and if the matrix has its own axis (x or y).
If the series has its own axis the it is display using the whole
available space (horizontally or vertically), independently by the
other series.
If
you
select the matrix and the series name is empty, the series name textbox
is filled with the matrix name.
Clicking
OK the
dialog closes and series is added to the chart.
Clicking
Cancel the
dialog closes and nothing is added.
