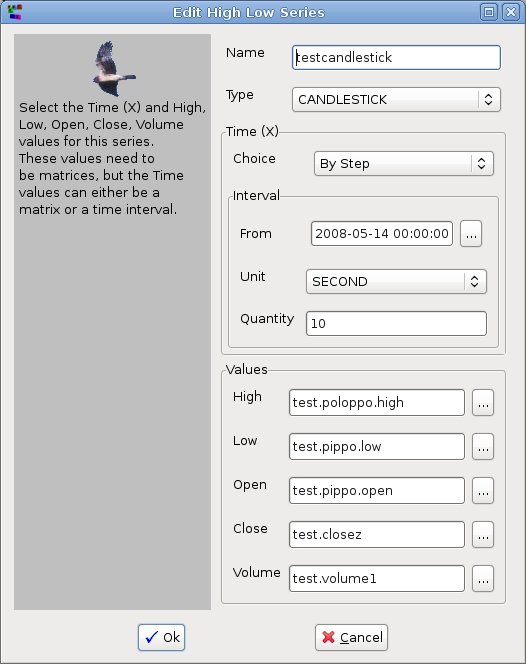
The
Add High Low
Dialog
This is
the
dialog to enter high low
series in a chart.
Here you:
Specify
the series name.
Choose the series type: candlestick or high low.
Choose
the type of X values (Time
Choice) betweeHigh An By Dates and By
Step.
If you choose By Dates you select the X matrix
(Dates)
in the same way as the other matrices.
If you choose By Step you
will specify the start of the interval as date/time value as specified
in the GUI settings. You can enter the date/time
value directly or, by clicking on the ... button, using the date-time
picker dialog.
In
the Values panel you speacify the 1-dimensional numeric matrices that together form the series: high, low, open, close and, if the series type is candlestick, volume.
The
series must all have the same size. If you have specified a date matrix
to fill the X axis, also this matrix must have the same size as the
others.
Clicking
on the OK
button the dialog is closed and the series is added to the chart.
Clicking
on the Cancel
button the dialog is closed and nothing is added to the chart.

